

Technical analysis is a powerful tool, but we have all had cases where it did not work as expected. Many traders fall into common traps, especially in the very beginning of their trading journey. Read on to learn how to recognize these traps and avoid falling into them.

A setup may look perfect on a short-term chart, but it may completely contradict the trend on a higher timeframe.
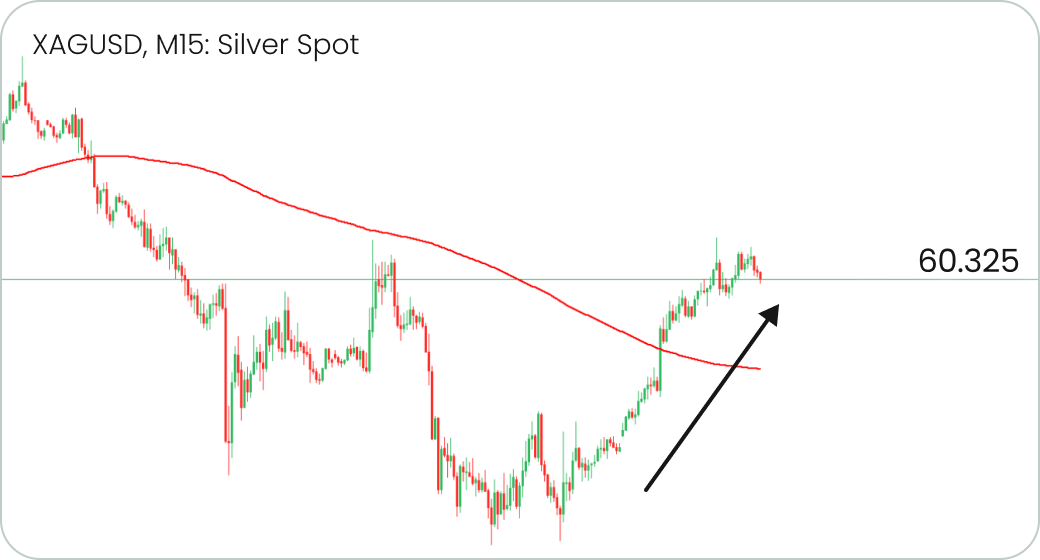
This 15-minute chart shows a downtrend, with the price breaking below the 50-MA and retesting it. That’s a clear downtrend, right?
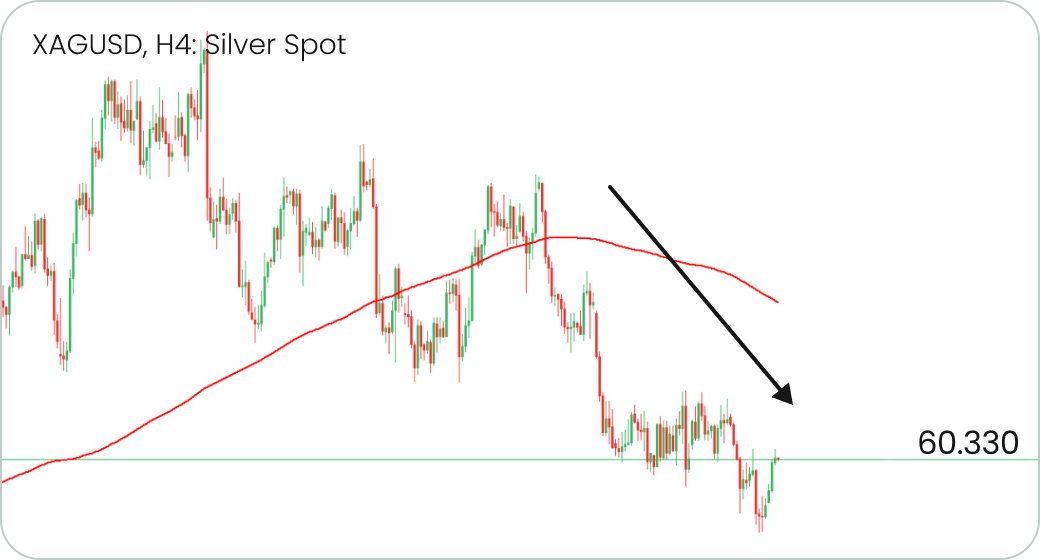
The daily chart, however, shows an obvious uptrend. Going against it is risky. Higher timeframes generally carry more weight and should be used to determine your overall sentiment.

Charts do not exist in a vacuum. Economic reports, central bank announcements, political decisions, and geopolitical events can radically change sentiment in minutes. Any technical configuration can prove ineffective if unexpected news arrives.
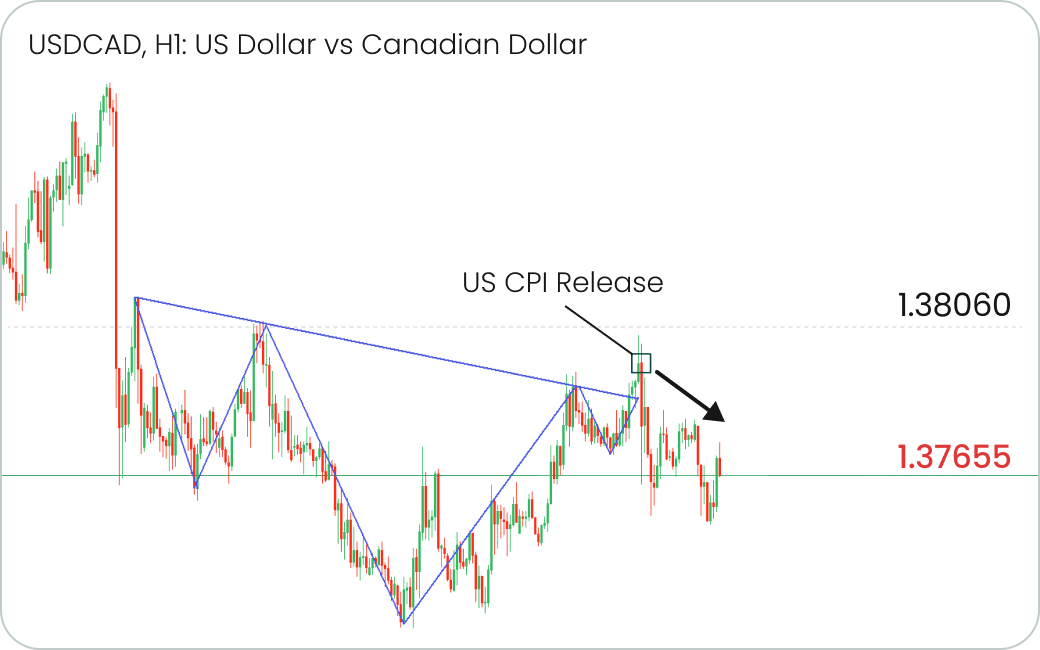
We saw a reverse Head and Shoulders pattern (a powerful bullish signal), but a good US CPI report changed the situation, and the signal didn’t work.

A common error is entering a trade based on a single signal, such as an overbought RSI. However, false signals are absolutely possible.
How not to fall into the trap
Enter a trade when multiple factors confirm your intention:


A price line may break the support or resistance level (and trendlines) and then sharply return. Fake breakouts like these can compel traders to enter the market too early.
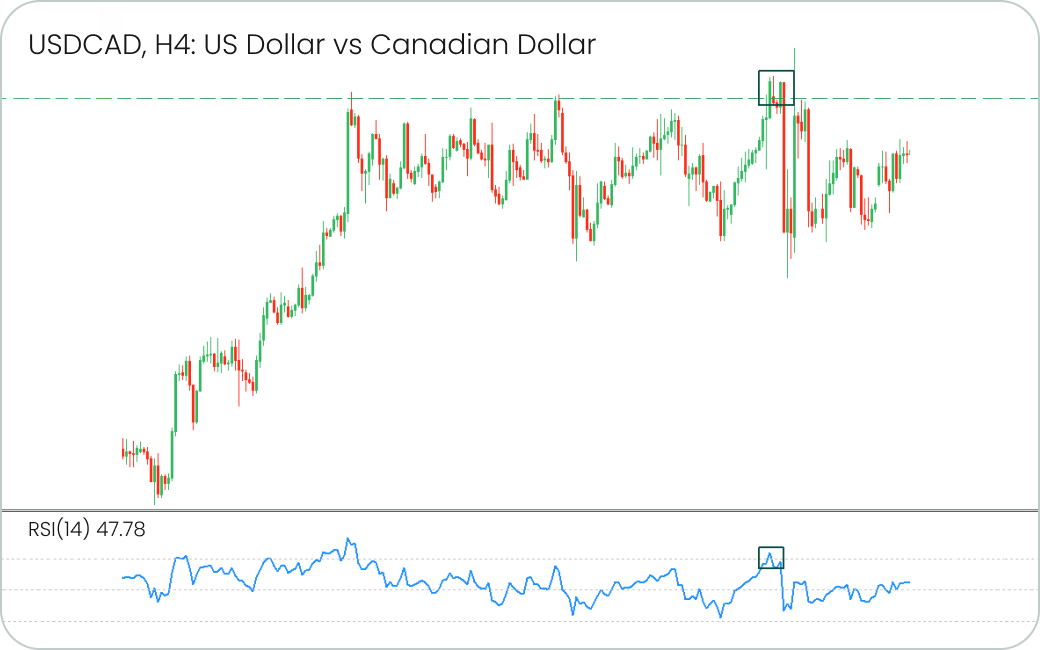
The price broke above an important resistance level, but then rolled back. The RSI would be helpful in this case, as it would indicate that the instrument is overbought and further long positions are risky.
How not to fall into the trap

Traders tend to overload charts with indicators, such as RSI, MACD, and Momentum, and make decisions based on all of them. Conflicting signals may overwhelm and confuse you, causing missed opportunities.
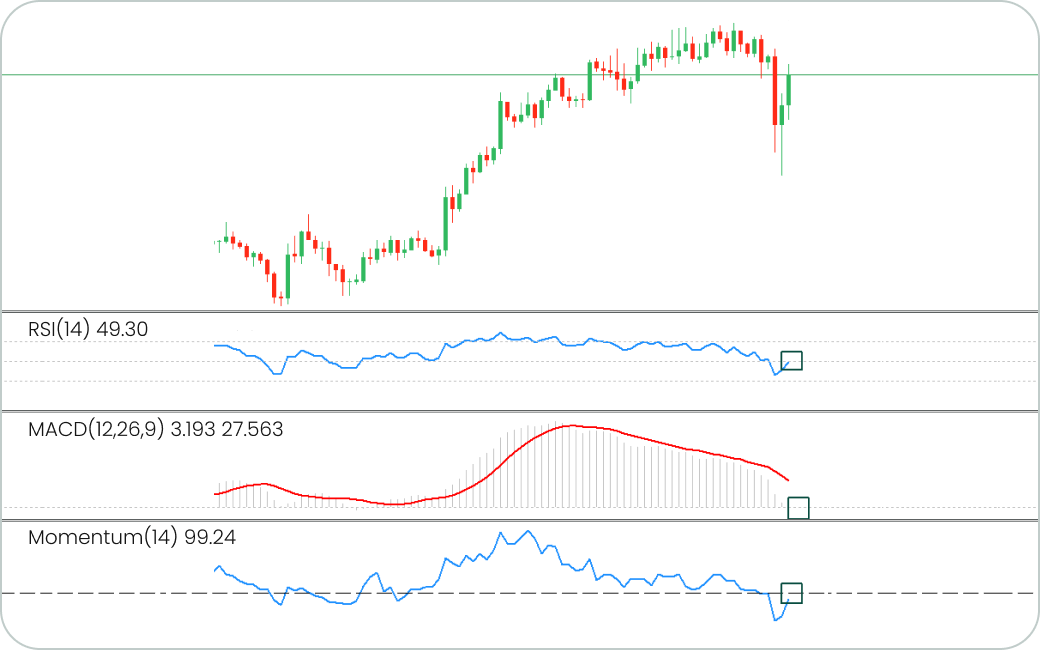
The RSI and Momentum cross the mid-line upwards, suggesting bullish momentum. However, the MACD crosses the 0-line downwards, giving a bearish signal.
How not to fall into the trap

•Most Trusted Broker — 2026
These awards confirm our commitment to building a rewarding trading environment and helping you uncover your potential. Thank you for choosing to trade with an award-winning broker!
Choose MetaTrader 5 with Top Forex Brokers?
•Blazing-fast execution & enhanced stability
•38 built-in technical indicators & 21 timeframes for precision trading
•Optimized for all devices—desktop, mobile & web
•Trade a wide range of assets: Stocks, Commodities, Forex & more!
https://www.topforexbrokerscomparison.com
*Tips and analytics do not constitute a call to trade, trading advice or recommendation and are for information only.